How easy is it to draft the best player available? Should be pretty easy, but let’s see how successful teams have been. The first post about this covers 2000 to 2003, so let’s keep going with it.
2004
This draft seems to be a bit of a rarity as the teams nailed it on the first two picks but after that, a huge failure by every team, many times. With the first overall pick, the Washington Capitals selected the best player available, Alex Ovechkin. With the number two selection in this draft, the Penguins selected fellow Russian Evgeni Malkin. Great, so far the teams are two for two in nailing the best player available. But Chicago had the third pick and went with Cam Barker. Using Point Shares, the difference between Barker and Malkin is more than 108 points. Huge. Who was the third best player available? That would be the player who was chosen 258th, by the Nashville Predators, Pekka Rinne. With the fourth selection in the draft, the Carolina Hurricanes took Andrew Ladd, but the fourth best player was Devan Dubnyk, taken 14th overall by Edmonton. And to fill out our top five, the Phoenix Coyotes actually did take the fifth best player available, Blake Wheeler.
Pick
Player
Team
Pick
Player
Team
1
Alex Ovechkin
Capitals
1
Alex Ovechkin
Capitals
2
Evgeni Malkin
Penguins
2
Evgeni Malkin
Penguins
3
Cam Barker
Blackhawks
258
Pekka Rinne
Predators
4
Andrew Ladd
Hurricanes
14
Devan Dubnyk
Oilers
5
Blake Wheeler
Coyotes
5
Blake Wheeler
Coyotes
2005
Just like in 2004, the best player available was selected first overall. After that pick, teams weren’t terrible but also didn’t exactly nail it either. The first overall pick went to the Pittsburgh Penguins and they took Sidney Crosby. Crosby has about a 100 point lead in Point Shares over the actual second selection in the draft. The Ducks took Bobby Ryan second overall. The second best player overall was taken fifth, by the Montreal Canadiens, Carey Price. The third pick went to the Hurricanes and they took Jack Johnson. Imagine if the Hurricanes had instead taken the third best player available, Anze Kopitar. Kopitar was actually taken 11th overall by the Kings. The fourth pick in the draft went to the Minnesota Wild and they took Benoit Pouliot instead of a goalie, the fourth best player selected, Jonathan Quick. Quick was taken 72nd overall by the Kings. So yes, the Kings got the 3rd and 4th best players in the draft with the 11th and 72nd picks. And as noted earlier, the fifth pick in the draft was Montreal taking Carey Price. Some segments of the Bruins fan population might not like to hear who was the fifth best player available, goalie Tuukka Rask, selected 21st overall by Toronto and later traded to Boston for Andrew Raycroft.
Pick
Player
Team
Pick
Player
Team
1
Sidney Crosby
Penguins
1
Sidney Crosby
Penguins
2
Bobby Ryan
Ducks
5
Carey Price
Canadiens
3
Jack Johnson
Hurricanes
11
Anze Kopitar
Kings
4
Benoit Pouliot
Wild
72
Jonathan Quick
Kings
5
Carey Price
Canadiens
21
Tuukka Rask
Maple Leafs
2006
In this draft, two top five best available were taken in the top five, but it wasn’t the top two picks. The Blues had the first overall pick and chose Erik Johnson. The Capitals were the fortunate ones, getting the best player available with the fourth overall pick, Nicklas Backstrom. The Penguins chose next and after hitting a home run the previous year with Crosby, took Jordan Staal. The Capitals got the second best player available in Semyon Varlamov with the 23rd overall pick. In spite of getting the top two best players in the draft, Varlamov wasn’t a part of the Caps’ Cup win. The Blackhawks chose third and took their current captain, Jonathan Toews. Toews has only been the fifth best player in that draft. The best available to the Blackhawks was Phil Kessel, taken fifth by the Bruins. Backstrom was next, taken 4th by the Caps, but the fourth overall best player in the draft was taken 71st, by the Bruins, Brad Marchand. Fifth overall was Kessel and fifth best was Toews.
Pick
Player
Team
Pick
Player
Team
1
Erik Johnson
Blues
4
Nicklas Backstrom
Capitals
2
Jordan Staal
Penguins
23
Semyon Varlamov
Capitals
3
Jonathan Toews
Blackhawks
5
Phil Kessel
Bruins
4
Nicklas Backstrom
Capitals
71
Brad Marchand
Bruins
5
Phil Kessel
Bruins
3
Jonathan Toews
Blackhawks
2007
In this draft, the first overall pick did nab the best overall player and then the rest of the top five is a bit of a mess. First overall was the Chicago Blackhawks and they did get the best available in Patrick Kane. Second was the Flyers who selected James van Riemsdyk. Definitely not a bad player but Jamie Benn has a higher PS score and was taken by Dallas with the 129th overall pick. Third was the Coyotes taking Kyle Turris instead of the third best player available, PK Subban, taken 43rd by the Canadiens. Next was the Kings, taking Thomas Hickey but the Canadiens did get the fourth best player available when they took Max Pacioretty at 22. Finishing out the top five was the Capitals taking Karl Alzner instead of the best available at this slot, Jakub Voracek, taken by the Blue Jackets with the 7th pick in the draft.
Taking the best player available sounds pretty easy. Spend all that money on scouting and analysis, and then on draft day, have all the players ranked and take the best one that’s on the board. What if you even have the first overall pick? You’re the team who can have any player you want with no worry that some other team is going to grab the player before you get to pick. Should be really easy, right? How many times in the 17 drafts that have been analyzed here so far, did the team with the first overall pick take the best player available?
Answer: 9
So approximately only half the time, the team with the number one overall pick was able to identify the best player available. Some were even missed badly. Some years, every team whiffed on the best player available, as that player wasn’t even taken until after the first round. Let’s look at the players take and who should have been take first overall.
2000
The first draft I’ve tracked, 2000, was an interesting year. A goalie was the first pick in the draft and a goalie was the best player available in the draft. Sounds like it should be a slam dunk. You’d also think the best player would be taken somewhere in the first 200 picks. But he wasn’t. In this draft, Rick DiPietro from Boston University was selected first overall by the Islanders and in 2006, signed a 15 year contract. A contract that would have expired only this year. But the best player available was taken 205th overall, in the 7th round, by the other New York City team, the Rangers, Henrik Lundqvist. The rest of the top five selected were Dany Heatley by Atlanta, Marian Gaborik by Minnesota, Rostilav Klesla to Columbus and Raffi Torres to the Islanders. The best players available after Lundqvist were Gaborik, Heatley, then Justin Williams by the Flyers at 28 and Lubomir Visnovsky, taken by the Kings at 118. We have two players selected after the top 100 and one that barely made it into the first round that were among the top five players.
Pick
Player
Team
Pick
Player
Team
1
Rick DiPietro
Islanders
205
Henrik Lundqvist
Rangers
2
Dany Heatley
Thrashers
3
Marion Gaborik
Wild
3
Marian Gaborik
Wild
2
Dany Heatley
Thrashers
4
Rostilav Klesla
Blue Jackets
28
Justin Williams
Flyers
5
Raffi Tores
Islanders
118
Lubomir Visnovsky
Kings
2000 Actual Draft and Top 5 Best Available
2001
The 2001 draft was only marginally better, but by a slim margin. The top five players selected were: Ilya Kovalchuk to Atlanta, Jason Spezza to Ottawa, Alexander Svitov to Tampa Bay, Stephen Weiss to Florida and Stanislav Chistov to Anaheim at #5. These look like a couple pretty big whiffs at what should be some easy selections. The top five players available in this draft were, Craig Anderson to the Blackhawks at 73, Mike Smith to Dallas at 161, Spezza at 2, Kovalchuk at 1 and Jason Pominville to Buffalo at 55. That’s three players that any team could have easily had with their first round pick. We’re only looking at the first five picks in a draft and it already seems like it’s hard to take the best players.
Pick
Player
Team
Pick
Player
Team
1
Ilya Kovalchuk
Thrashers
73
Craig Anderson
Blackhawks
2
Jason Spezza
Senators
161
Mike Smith
Stars
3
Alexander Svitov
Lightning
2
Jason Spezza
Senators
4
Stephen Weiss
Panthers
1
Ilya Kovalchuk
Thrashers
5
Stanislav Chistov
Ducks
55
Jason Pominville
Sabres
2001 Actual Draft and Top 5 Best Available
2002
In 2002, we can say that three of the top five players were selected in the top 5. The draft order this year was Rick Nash to Columbus, Kari Lehtonen to Atlanta, Jay Bouwmeester to Florida, Joni Pitkanen to the Flyers and Ryan Whitney to the Penguins. However the order of the best players available in the top five is Lehtonen at 1, Cam Ward was taken 25th by Carolina, Duncan Keith at 54 by the Blackhawks, Nash 4th and Boumeester fifth. The sixth best player available in this draft was Dennis Wideman, who’d been selected 241st overall by Buffalo.
Pick
Player
Team
Pick
Player
Team
1
Rick Nash
Blue Jackets
2
Kari Lehtonen
Thrashers
2
Kari Lehtonen
Thrashers
25
Cam Ward
Hurricanes
3
Jay Boumeester
Panthers
54
Duncan Keith
Blackhawks
4
Joni Pitkanen
Flyers
1
Rick Nash
Blue Jackets
5
Ryan Whitney
Penguins
3
Jay Boumeester
Panthers
2002 Actual Draft and Top 5 Best Available
2003
This draft finally had the best player chosen first, but then a couple other misses. The Pittsburgh Penguins drafted first overall and got their franchise goalie, Marc-Andre Fleury. Next up was Carolina, taking Eric Staal, then Florida drafting Nathan Horton. At 4, Columbus took Nikolai Zherdev and Buffalo finished the top five by taking Thomas Vanek. If we look at the top five available, it starts with Fleury but then goes to Brent Burns, selected 20th by Minnesota, then Shea Weber taken 49th by Nashville. Nashville also got the fourth best player in this draft at 7 overall with Ryan Suter. In fifth place, and just barely beating out Staal is the 45th overall pick to the Boston Bruins, Patrice Bergeron.
Each year, all NHL teams are given seven draft picks, roughly in the reverse order of how they finished in the standings. Teams are free to trade those picks for other picks or for players. In a normal year, if you can get an NHL contributing player out of your first two rounds, you’ve done pretty ok for the team. Definitely not something that I’d consider a failure.
From the 2015 draft, the Bruins did exactly that, and more. They got at least two contributing NHL players from the first two rounds, Jake DeBrusk and Brandon Carlo. Jakub Zboril can also even be considered a bonus. However, some segment of the Bruins fan population like to claim that the franchise was ruined, destroyed, by that draft.
The Bruins franchise was NOT destroyed by that draft. Teams whiff on draft picks every year. There is no single draft that destroys a team. However, the Bruins could have done much, much better at the draft. There is no question about that. There were much better players available than they took. But being able to do better and destroying the team are two vastly different things. I do think that if they drafted better, the Bruins would be better. But again, that is totally different than “ruined the team.”
In 2015, the Bruins whiffed, and whiffed badly. Their picks of Zboril, DeBrusk and Senyshyn were not the best players available at the 13, 14, and 15 draft slots. This is not an apology for the Bruins draft that year (it was terrible!) but more of an explanation that yeah, teams miss. So let’s try this. With the 100% benefit of hindsight, let’s redo the 2015 draft and see who each team would end up with.
In past articles, I’ve explained the system I’m using based off the Point Shares metric from Hockey Reference. If we’re going to use the narrative that the Bruins should have been perfect and nailed all three of those picks in 2015, then let’s be consistent and use the narrative that every team nailed their picks too. So either “stuff happens” and teams miss on picks (as the Bruins did) or “everyone should be perfect” and we’ll see what the first round of the 2015 draft looks like, if every team took the Best Player Available.
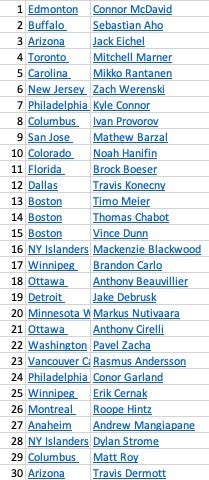
Redoing the 2015 NHL Draft
There we have it. The Bruins should have ended up with Timo Meier, Thomas Chabot and Vince Dunn. No question, that’s still far better than what they ended up with, but all the clamor that they should have Barzal or Connor or Boeser doesn’t hold water. We can’t expect the Bruins to be perfect and not expect that everywhere else.
Some of the other interesting spots, DeBrusk isn’t even the highest ranking Bruin. Brandon Carlo was one spot after the Bruins selected, going to Winnipeg. And DeBrusk, rated as the 19th best North American skater by the NHL’s Central Scouting rankings is the 19th best player from the 2015 draft, just five spots lower than he was actually selected.
We see that McDavid and Marner were selected right where they’ve turned out. But imagining Carolina with Mikko Rantanen instead of Sebastian Aho. Imagine Kyle Connor on Broad Street with the Flyers. Noah Hanifin going to Colorado, instead of Rantanen. The emerging Mangiapane in Anaheim. And imagine Roope Hintz in Montreal instead of in Dallas.It’s a fun exercise and sure, yell and scream for Don Sweeney to be fired. But to claim that the team was ruined by this one draft is just nonsense. If someone wanted to make the argument that the Bruins have been more harmed by the four years of 2017 to 2020 first round draft picks being:
2017: Urho Vaakanainen
2018: No pick
2019: John Beecher
2020: No pick
then that could hold more weight. The team is still waiting on Urho to develop into an NHL player, Beecher is still in college and when you give up your first round pick, you’re hampering the team’s ability to add young, cheap talent later.
The Boston Bruins are far more hampered by these four draft years than it is from the result of the 2015 draft.
This started with some Bruins fans exclaiming that the Bruins, and Don Sweeney in particular, are terrible at drafting players. So I decided to look at the facts.
I started out with this article, Analyzing Bruins Drafts, but then some suggested that just using games played is not a good metric for how good a team is at drafting. Games played is the not the goal when selecting a player, getting the best player available (BPA) is the goal. One way to do that is to analyze the draft by a particular metric and then rank all the players in a draft by that metric. I used Point Shares (PS) from hockey-reference.com. If someone doesn’t like PS and has a better suggestion on how to evaluate drafts, I’m open to suggestions.
First, I tested this out by looking at the 2015 and 2016 drafts and using PS, determined how each team did. In 2015, the Bruins did very badly, as one would expect, with the 28th best (out of 31) draft. DeBrusk and Carlo pulled some value out of it for the team. In 2016, the Bruins improved, largely by selecting Charlie McAvoy at 14, the fourth best player in the draft.
I didn’t continue forward with this for 2017, 2018 and more because players are still developing from those drafts and still making their debut in the NHL. But I did want more data and to know, somewhat historically, which teams are good at drafting and which teams don’t fare as well. So I went backwards. I used PS to rank every team’s draft from 2000 through 2016. Then I simply averaged out their annual result. If a team had the best draft one year and the worst draft the following year, they get a 1 and a 31 and end up with an average of 16. But I did that for all 17 years from ’00 to ’16. Here’s the result:
Ranking How Well Teams Drafted
So one thing that will certainly stick out is that the Bruins, during this time period, definitely do not “suck at drafting.” That’s just categorically false. However, if they want to say the Bruins under Don Sweeney aren’t so good at it, he has two years rated with my system, and would get a 20. Which you can see above, 20 would be 29th overall, pretty terrible.
At some point, it will be fun to dive in and see why teams are ranked where they are and go through a few drafts, especially the teams at the top and the bottom. Now that I have all the data in a spreadsheet, I have a few other questions I’d like to answer like how do successful drafts correlate to finishing better in the standings? How long does it take for the draft results to show up in the season standings? How hard is it to get the Best Player Available? How often does the team with the #1 overall pick actually take the BPA? Should be easy, right? They can pick any player they want, anywhere on the board, it should be easy to take the best one. Does that happen often? How about from there, what order to players get selected? Or even redo some drafts using PS, and show what they’d look like and who would have been available at each team’s draft position. And I would also like to tie in GM names, and possible scouting director names, to the drafts, so we can see who is responsible for doing well or doing poorly in those years. Is there one GM who has been with a couple teams and done really well? That might be fun to see. And, I do think there is a degree of “crapshoot” to drafting 18 year old kids. So how many that are in the top 30 according to PS were drafted outside the first round? Monday morning quarterbacks seem to think it’s easy to just take a Patrice Bergeron or Kiril Kaprisov early, yet every NHL team passed on guys like that, multiple times.
Boston Bruins Drafts 2000 to 2016
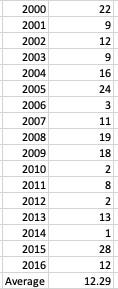
How did the Bruins finish third overall in the draft scoring? Here’s how they did each year:
Bruins Draft Ranks
As I was calculating the average for each team, I was skeptical of the Bruins’ 12.29 average, so I checked it multiple times. Some teams who scored lower, appeared to be better when just using the eye test. But when I went back and checked why the Bruins did so well, it’s largely because they didn’t take a couple big numbers. They do have that glaring 28 in 2015 and the 24 in 2005. But other teams took a couple extra numbers in the high 20s, along with some single digit years.
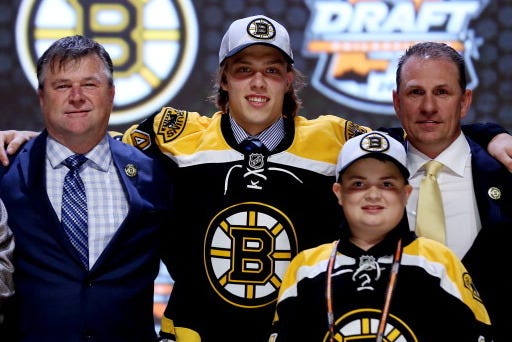
What did the Bruins do well? How did they have the best overall draft in 2014? Easy. They hit a grand slam with the 25th overall pick in the draft:
David Pastrnak on Draft Day
According to PS, Pastrnak was the second best player taken in that draft, only behind the #3 overall pick, Leon Draisaitl. The way my ranking system works is teams get a score for every pick. That score is the BPA’s PS minus the draft pick’s PS. So for example, the top pick in the draft was Aaron Ekblad to Florida. Ekblad is a great player, a PS of 48.4 (when I ran the numbers). But Draisaitl was the BPA with a PS of 63.5, so Florida gets a -15.1 score for their pick. Buffalo chose Sam Reinhart second. Reinhart is 30.4, so Buffalo got -33.1 for their pick. Edmonton chose Draisaitl next, so they get a 0, which is actually a perfect score for a team’s pick. After that, the BPA was Pastrnak and his 58.4 PS, so every team’s pick is compared to that.
But, this system rates every single pick in the draft, not just the first round. To finish first overall one year, a team needs to have more than one good pick. And while some may look at the players and think “Eww, he’s not that good.” The system is rating players based on their PS score compared to the best player available at that moment. So the rest of the Bruins draft in 2014, with the player PS and their relative score was:
2. Ryan Donato, 7.5, -31.1 (BPA: Brayden Point, 3rd Round)
3. No pick
4. Danton Heinen, 11.8, -3.4 (BPA: Kevin Lebanc, 6th Round)
5. Anders Bjork, 3.7, -11.5 (BPA: Kevin Lebanc, 6th Round)
6. No pick
7. Emil Johansson, 0, -1.6 (BPA: Jake Evans, 7th Round)
In addition to Pastrnak, the Bruins hit on three NHL players out of their remaining four draft picks. That’s how you get a top score. When a team doesn’t get a pick, that does result in a 0. Maybe this is an area where the system can be improved, as earlier I noted that a 0 is a “perfect score” so for a team to get that in a round by not having a pick would seem to benefit teams to trade away draft picks. However, the goal here is to figure out who is good at drafting the best player available, it does not look at whether a team should have kept picks or anything like that.
How about in 2012? How did the Bruins have the second best draft? In short, it wasn’t a very good draft. Virtually everyone did really poorly. Look at the top five picks: Nail Yakupov, Ryan Murray, Alex Galchenyuk, Griffin Reinhart, Morgan Reilly. If we rank the BPA, the top five would be Freddie Anderson (Drafted at 87), Andrey Vasilevskiy (19), Connor Hellebuyck (130), Filip Forsberg (11), Morgan Reilly (5). To do well in a weak draft class just means don’t totally screw it up and get a decent player or two, maybe get the best player available at one spot, and that’s what the Bruins did. Here’s their draft, and keep in mind, this is about drafting, not whether the player has contributed to the Bruins:
Draft Round, Player, PS, Draft Score 1. Malcolm Subban, 10.2, -65.2 2. No Pick 3. Matt Grzelcyk, 17.6, -57.8 4. No Pick 5. Seth Griffith, 1.2, -20.8 5. Cody Payne, 0, -22 6. Matt Benning, 15.3, 0 (Best Player Available!) 7. Colton Hargrove, 0, -1.4
There’s more to come, but that’s at least a little bit about how the Bruins have drafted over the last couple decades, and gives us an idea how they compare to other teams. Choosing the right players on draft day isn’t easy, the Bruins have their share of hits and misses, but clearly all NHL teams do as well.
This is my amateur analytical way of analyzing NHL team drafts. I started with looking at first round drafts for all teams from 2015 to 2020 in my post Analyzing Boston Bruins Drafts and then a changed methodology that looked at all 2015 draft picks for all teams The Sebastian Aho Penalty.
In a nutshell, I’m trying to figure out which teams are better at drafting and whether teams actually are better than others at drafting. Is it all about luck, or just about draft position? This post is a follow-up to the 2015 article, as in this one, I just look at the 2016 draft for all rounds, all picks.
I went into the updated methodology in the Aho post, but in short, the goal of the draft is to get the best player available with a pick. It’s impossible for one team to always pick the best player available, so I look at just how much they missed by, using the Point Shares statistic published on hockey-reference.com.
In 2015, the team who did the best was the Edmonton Oilers, as they got Connor McDavid with the first overall pick and they avoided what I termed the “Sebastian Aho Penalty” with their second pick. The team that did the worst, largely because they had three first round picks and none ended up being Sebastian Aho, the Boston Bruins ended up at the bottom of the pile. Let’s see how the teams did in 2016.
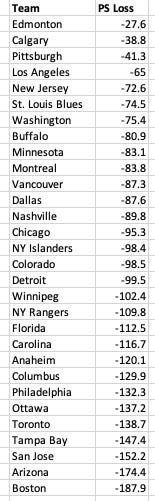
The 2016 draft was headed up with Auston Matthews going to Toronto at 1, then Patrik Laine to Winnipeg at 2 and Pierre-Luc Dubois to Columbus at 3. We all remember the somewhat recent trade between these two players as Dubois is now in Winnipeg and Laine in Columbus. Just as in 2015, the first overall pick was also the best player available (BPA), so Toronto does not get penalized for taking Matthews. Who was the first breakpoint after that, meaning who was the next BPA? With a Point Shares (PS) score of 32.8, it was 6th overall pick Matthew Tkachuk to Calgary. But Laine has a PS of 32.7, meaning Winnipeg only gets a -0.1 score for that one. Dubois has a 20.8, resulting in a -12 for Columbus. At 4, Edmonton selected Jessi Puljujarvi with a PS of 7.1 and a -25.7 score for Edmonton. The biggest penalty of the first round comes at 6th overall when Vancouver selected Olli Juolevi and his 0.8 PS for a penalty of -32. Other early breakpoints include Charlie McAvoy to Boston at 14, then Alex DeBrincat at 39 to Chicago, Sam Girard at 47 to Nashville and Adam Fox at 66 to the Calgary Flames.
Here’s how the total scores broke down for the 2016 draft.
2016 NHL Draft Scores
The first thing to notice is the teams that did well in 2015 ended up at the bottom in 2016. Edmonton was the top team at the 2015 draft and dropped to the bottom in 2016. The main misses for the Oilers were taking Puljujarvi at 4 with Tkachuk on the board, then taking Tyler Benson at 32 (a -0.2 PS score) with DeBrincat available and Markus Niemelainen (0 PS) with Adam Fox the BPA.
Carolina’s draft included Jake Bean at 13 and his 2.7 PS score with McAvoy available, Julien Gauthier at 21 (0.4 PS) with DeBrincat available and Janne Kuokkanen at 43 (1.6 PS) with Sam Girard waiting to be picked.
In this draft, the top two teams got there almost by default, with a lack of picks. Minnesota only had four first round picks and relatively speaking, did ok with them. Their first pick was Luke Kunin at 15, immediately after the breakpoint of McAvoy had passed. Kunin has a PS of 6.5 resulting in a score of -21.5 for Minnesota and their other pick to have a PS is Brandon Duhaime at 106th with a PS of 0.5 and a score of -12.3. The breakpoint for the Duhaime pick was Jesper Bratt to New Jersey at 162 and a PS of 12.8.
The Rangers didn’t have a pick until 81st overall where they took Sean Day (0 PS) and Tarmo Reuanen with a 0.2 PS score. The Rangers didn’t acquire anyone in this draft who has truly contributed to the team. The Rangers did end up with a huge piece to their team from this draft, as they later trade for Adam Fox. Fox had been traded from Calgary to Carolina and then the Rangers sent a second and third round pick to Carolina for Adam Fox. Just to note, trades are not factored in to these numbers. Calgary gets all credit for drafting Fox in this project.
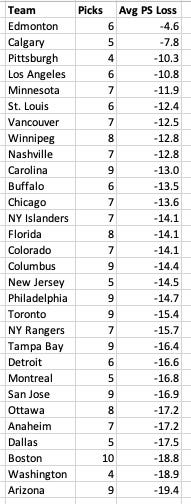
With Minnesota and New York getting to the top through a lack of picks, how did they do when we average out their PS per pick?
2016 Draft Average Score
The Rangers actually slide up to the top spot and Minnesota drops to 5th. The Canadiens rise up to 2nd place based on their decent draft where they got three players who have earned a PS score. Their best was taking Mikhail Sergachev at 9. He has a PS of 23.5 for a score of -5.2 from McAvoy. Their next pick with a score was Victor Mete at 100 with a PS of 9.9, not that far off from Bratt’s 12.8. Montreal’s other pick getting a score is Michael Pezzetta at 160th and a 0.2 PS score.
For the Bruins fans who love to deride Don Sweeney and claim he’s the worst GM at drafting, the Bruins finished the 2016 draft at 8th in total and 11th in average, both solidly in the top half of this draft. The Bruins hit the jackpot with McAvoy at 14 and his 28.7 PS, but they also got Ryan Lindgren at 49th (later traded to the Rangers in the Rick Nash deal) who has a 7.8 PS. With the 29th pick in the draft, the Bruins selected Trent Frederic. He has a -0.6 PS and earned the Bruins a -28.6 penalty, largely the reason for their drop in the average. One to keep an eye on is Oskar Steen. He was drafted at 165 and is getting a look in Boston right now. Point Shares is a score that changes game by game, so all of these scores and standings are subject to change as more players make it to the league and contribute. For this reason, 2016 is the last draft that I’ll do at this time. There aren’t enough players from 2017 on who have made it to the NHL to have a big enough sample size for comparison among teams.
Among Bruins fans, there’s often a loud group who hate General Manager Don Sweeney because of the 2015 draft. That draft was loaded with talent and while the Bruins ended up with multiple players who have contributed in the NHL, they could have done much better.
This led me to try to analytically figure out how good or bad Sweeney’s drafts have been. But to me, “good or bad” are subjective terms that need to be measured against his peers. So I am trying to compare his results to all other teams, and resulted in this, Analyzing Boston Bruins Drafts.
That led to some people enjoying it, some people deriding it and some offering alternative suggestions, including a path offered on Twitter by @CFPZach and Shawn Ferris of Evolving-Hockey.com. Shawn’s feedback was that games played is not best measure of a successful draft, it’s selecting the best player available at the time of the team’s pick. Let’s just agree that it is impossible for one team to always choose the best player available. With that in mind, the goal then is to minimize the losses and end up with a player who is still really good. Shawn’s suggestion then was to take a stat and compare the draft pick’s stat to the best player available (BPA) and calculate the “loss”. Then you can see how much loss one team took in a draft and rank those. Shawn’s suggestion for the stat was to use either “Wins Above Replacement” (WAR) or “Goals Above Replacement” (GAR).
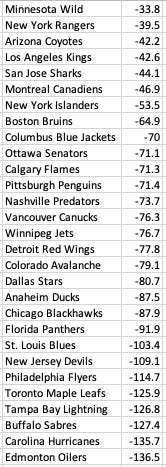
I plan to use GAR for this analysis, but in the meantime, I did a quick check of the 2015 draft using the Point Shares (PS) stat from hockey-reference.com. I copied down two tables, first the order of the entire draft, and then the PS for every player in that draft. From there, I figured out for each draft pick who was the BPA at that moment. If it was the player selected (ie. Connor McDavid at #1 overall), then the team got a 0. As selecting the best player available is the goal, I don’t reward that, but the team does avoid a penalty. If the player was not the BPA, then I subtract the Point Share value of the Best Player Available, from the team’s draft pick. So how did it turn out and what is this “Sebastian Aho Penalty” mentioned?
As readers can guess, McDavid has the highest PS of any player selected in the 2015 draft, so the Oilers do get a 0 for that pick. Moving on to the #2 pick, Jack Eichel. Eichel has a 38.3 PS value, but is that the second best? Nope. The “Best Player Available” in the 2015 draft according to Point Shares is Sebastian Aho, who was taken 35th overall. This means that every player from Eichel through the 34th pick in the draft (Travis Dermott) is compared to Sebastian Aho, and his 40.9 PS score, at the time of this writing. Eichel is a great player with a great PS, but comparing him to Aho results in a -2.6 score for Buffalo. We see this penalty strongly come into play pretty quickly at the 3rd pick, Dylan Strome. Strome has a PS of 10.7 but counts as a -30.2 for Arizona in that slot.This penalty is truly amplified for the three first round picks by Boston:
Jake DeBrusk’s PS is 15.3, resulting in a -25.6.
Jakub Zboril’s PS is 2.0, resulting in a -38.9.
Zach Senyshyn has a PS of 0.2, giving the Bruins a -40.7 on his selection.
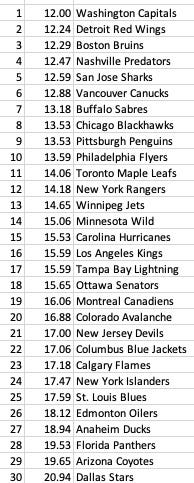
How the rest of the league fared:
Total Loss in Point Shares Per Team
Edmonton did extremely well by avoiding the Aho Penalty in the first round, the benefit of choosing McDavid. But one of the things that comes with the first overall pick is that you choose 31st overall. Aho was chosen 35th, so did Edmonton take the Aho Penalty in the second round? Nope. Their next pick was 117th overall, so they dodged it twice.
The Flames got extremely great value with Rasmus Andersson at 53 and a PS of 12.8, plus they got Andrew Mangiapane at 166 with a PS of 10.9. The Penguins also dodged the Aho bullet. Their first selection was 46th overall, taking Darren Sprong with a 6.2 PS and Dominik Simon at 137 and a 4.7 PS. The Bruins had 10 picks in this draft and their three first rounders don’t even combine for half of Aho’s value.
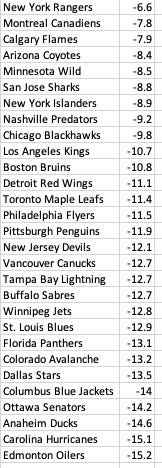
How did teams do if we average their loss per pick. Taking a look at the PS loss, averaged out:
Average PS Loss Per Pick
Not too much change at the top, Boston moves up a couple slots from the bottom but the big faller is the Capitals. They were 7th overall in PS loss but with only four picks, they were relatively big losses on each. They took Ilya Samsonov 22nd, who has a PS of 7.3 (-33.6) and they took Jonas Siegenthaler at 57. He has a PS of 3.2, resulting in a score of -11.8 to the Caps.
Each of the players that are the comparison, are considered “breakpoints”. Aho was the first breakpoint at 35th overall. But who were the rest? Next was Vince Dunn at 56th with a PS of 20.3, Markus Nuutivara at 189 with a PS of 15, Matt Roy with the Kings at 194th and a PS of 9.5, then Sami Niku of the Jets at 198th and a PS of 1.9 and the last breakpoint was Ottawa’s Joey Daccord at 199 and his PS of 1.1.
So there we have it. A first pass at figuring out how teams do when they don’t select the best player available. I’ll run these numbers again using the GAR value from Evolving Hockey and see how the standings change from here. As always, I’m open to suggestions for tweaks, as you can find me on Twitter at @plaverty24.@plaverty24
Note: A lot has changed with regard to methodology since I wrote this post over on Medium, but I’m keeping it here just to have a full history. So in short, I do not stand by the methodology in this post. See subsequent posts for updates.
“Don Sweeney stinks at drafting!” and “Don Sweeney is the worst at drafting players! He has no clue!”
That’s the context that we’re going on here, the random Bruins fans (and even an occasional hockey blogger) who have said some variation of these statements. I ask those people for examples of NHL General Managers who draft well, and some of the usual answers are Colorado and Tampa. We’ll see why, in this context, those aren’t really true.
We also need to point out that since Don Sweeney became the GM of the Bruins in May of 2015, the team has the third-most points in the standings, trailing only Washington and Tampa Bay. When you have the most points, it means you’re a good team and when you’re a good team, your picks are later in the draft. Good teams aren’t just handed top ten or top five picks.
General Managers can remake their team with some good draft picks, especially in the first round. It should be noted that the Bruins have not had a first round pick in two of Sweeney’s years, 2018 (traded for Rick Nash) and in 2020 (traded to offload the David Backes contract).
The Eye Test
What really sticks out for most people is the 2015 draft. The draft was deep and full of talent and the Bruins could have done much better. They did get Jake DeBrusk, taken right around where he was projected (taken 14th, rated 19th). They selected Jakub Zboril 13th, one spot lower than where he was projected by NHL Central Scouting. Zboril was rated higher than even Thomas Chabot (16th) on the Central Scouting draft lists. The real issue was the overreach for Zach Senyshyn. Even at the moment the pick was made, virtually everyone was baffled. Senyshyn was rated 38th overall and the Bruins took him 15th, with players like Barzal, Connor, Chabot, Boeser, Konechny, Beauvillier and Eriksson Ek still on the board. So that was a big swing and miss. But how has Sweeney fared overall in his tenure in Boston at the draft, when he had a first round pick?
How Data Was Used
I compiled data for every NHL team from 2015 to 2020 to figure out how the teams have done. I chose 2015 as the starting point because that was Don Sweeney’s first draft. We can’t fault him for drafts where he wasn’t a GM. And there aren’t enough players from the 2021 draft in the NHL to make much difference. Even 2020 is pretty thin.
I had to figure out how to evaluate the players and the drafts. Anyone can argue with my methods or even suggest tweaks. I’d be totally open to that as I’m not even convinced that I did this the best way. I made a spreadsheet of all the players drafted in the first round for the time period and looked up their NHL games played. As I’m doing this during the season, the numbers may not be exact as they change day to day. I ranked teams by the number of games played by their draftees from 2015 to 2020. I chose to use games played instead of points because using point totals would favor forwards over defensemen and basically eliminate any value from goalies. One area that probably needs some tweaking is a little extra weight for goalies. A skater can play a full 82 game schedule. A goalie who plays 55 or more is considered to have a really heavy load.
Parameters
This data only uses 2015 to 2020 NHL drafts, inclusive. I gave the drafting team credit for all games played, regardless of who they were played for. I’m figuring out teams’ ability to draft players, not their ability to keep them or how good the team is at trades. I only used first round picks. If a team didn’t have a first round pick one year, that’s a zero. For the purposes of averages, those years were ignored. So if a team had one first round pick each year except for one year, all averages used five as the denominator. If a team had more than one first round pick, all of those players were included.
The Data
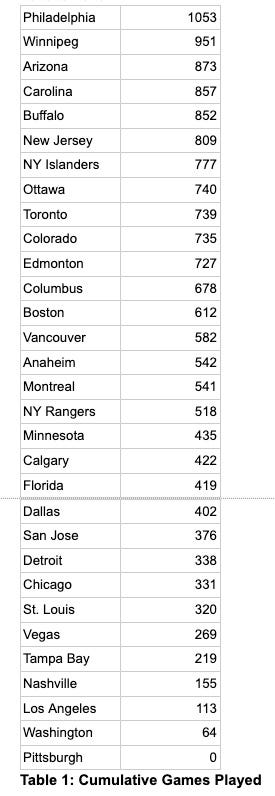
Let’s see how the teams rank by cumulative games played by their first round picks from 2015 to 2020:
(Apologies for table images. Medium doesn’t support tables for some reason)
One of the first things that probably jumps out is Pittsburgh and 0 games played by their first round picks for the six years from 2015 to 2020. They actually only have one draft pick in that time, Sam Poulin in 2019, and he has not played an NHL game. The Penguins did not have a first round pick in any other season. The players chosen in the Penguins’ slot those other years include Mathew Barzal, Sam Steel, Klim Kostin, K’Andre Miller and Rodion Amirov.
The Bruins are 13th overall in total games played as they have drafted seven players in the first round. They have six players who have NHL games played with DeBrusk, McAvoy, Frederic, Vaakanainen, Zboril and yes, even Senyshyn have played NHL games. John Beecher, currently playing at the University of Michigan, is the remaining first round pick for this time period.
The Flyers lead this chart based on Ivan Provorov, Travis Konechny and Nolan Patrick already having a solid number of games played. They’ve drafted seven players who have appeared in NHL games so far. Winnipeg has six players and are largely boosted by Connor, Laine and Roslovic.
Adding Context
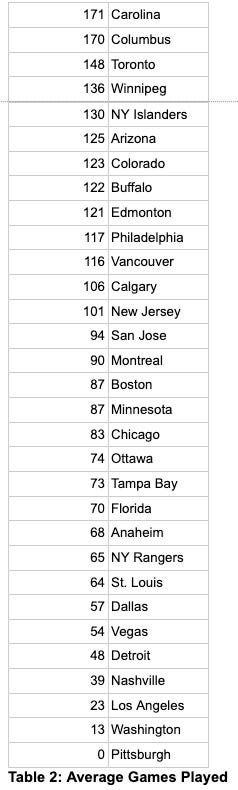
As I was putting the numbers together, I noticed that a team could be top-heavy where they have a player or two with a lot of games played and then a bunch of other misses, which could make them look better at drafting than they really are. So another way to look at the data is an average of NHL games played, using the number of players taken in the first round. That gives us this chart:
The Bruins are 16th overall for games played, bumped down three slots, but still right there in the middle. Their average isn’t helped by the small number of NHL games played by Senyshyn, Zboril and Vaakanainen, and carried by McAvoy, DeBrusk and Frederic.
Carolina is at the top as they have the Games Played leader in Noah Hanifin (449 vs. second place McDavid’s 420). Again, I did attribute all games played to the team who drafted them. Add in Svechnikov and you get your leader. Columbus gets the second spot based on Werenski and Dubois and Toronto comes in third due to Matthews and Marner.
Drafting Top Five is Easy
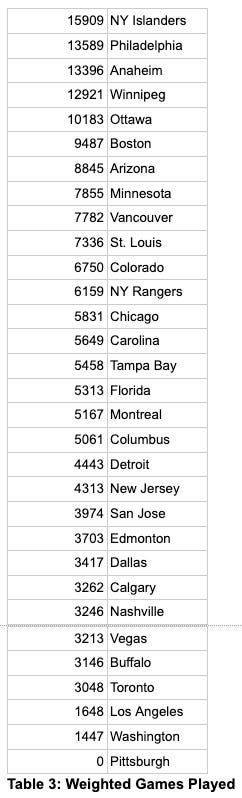
Another thing that I thought of here is the value of the pick. A GM doesn’t have to be particularly smart to draft Auston Matthews at first overall. That’s an easy pick. Even the top half of the draft can be easier to navigate. As teams get later in the round, it gets harder for a GM and scouting staff to pick out the hits. I wanted to give extra credit for getting games played from a player selected later in the first round. This is the part where my lack of experience in statistical analysis comes in. I don’t know what’s the best way to weight this, so I went for something easy. I chose to multiply the games played by the player’s draft position. It might be too much of a multiplier, but I am open to suggestions here. Anyway, here’s how that shook out:
The Bruins jump all the way up to sixth overall. The Islanders grab the top spot largely due to Anthony Beauvillier taken 28th overall in 2015. The Ducks do well in this area due to Jacob Larsson going 27th in 2015, Max Jones was 24th in 2016 and Sam Steel went 30th in 2016.
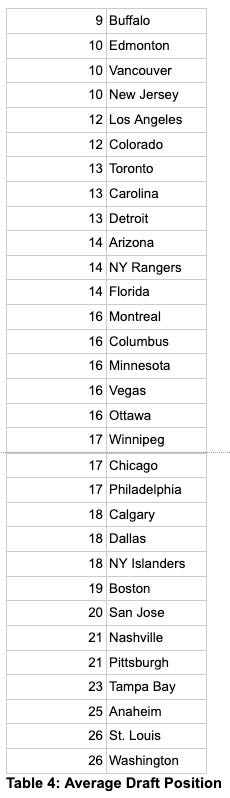
Average Draft Position
As referenced earlier, the Bruins have been a very successful team, in terms of standings points through Sweeney’s tenure. This usually means picking later in the draft. But teams do have the ability to move around and get different picks. I also calculated the average draft position for each team, using all of the first round picks that they made.
The Bruins average draft position is 19th overall, which is 24th best in the league. The Bruins are clearly drafting after the best players have been taken and it’s time to find some diamonds that need a little polishing.
Getting Value
The next thing I wanted to do is see which GMs are able to get value from their drafts. If we agree that games played has value and getting those games played from players selected later in the draft has more value in terms of showing which GMs can find those diamonds, I took it a step further. I multiplied the weighted games played in Table 3 by the team’s average draft position.
The Ducks do extremely well in this again due to the aforementioned three players taken at the end of the draft and their 25th average draft position. Yes, Bob Murray’s scouting and development have done very well in this time period. Similar for the Islanders with the Beauvillier pick. But this is also where we see the Bruins surge up the chart. They are in 6th place for the draft value. The argument here isn’t whether Sweeney is “best” at drafting, but based on this information, I think we see pretty solid evidence that compared to the rest of the league, he does not “suck” and it does appear that he does in fact, know what he’s doing. While there are teams who draft better, the results that the Bruins are getting is pretty good, relative to other teams. And when you combine this value with the fact that the Bruins also put a pretty good product on the ice, things are going well in Boston.
Two Teams Mentioned
Another common refrain is “Why can’t Sweeney draft like Colorado and Tampa! They know what they’re doing!” Let’s take a look at why “they know what they’re doing.” First, the Avalanche. During this time period, the Avs have an average draft position of 12, considerably higher than the Bruins 19. They do have more games played with 735 to the Bruins 612, but why? Who did Colorado draft in that time frame?
2015: Mikko Rantanen, 10th 2016: Tyson Jost, 10th 2017: Cale Makar, 4th 2018: Martin Kaut, 16th 2019: Bowen Byram, 4th, Alex Newhook, 16th 2020: Justin Barron, 25th
We can all agree that those first three picks are pretty great. But they’re also literally top 10 picks. Those are much easier to hit on. Once the picks get a little lower, the Avs got Kaut and Newhook. I’m not sure those are players that Bruins fans would be really excited about at this point. Based on this information, it doesn’t seem that Colorado is an apt comparison.
Let’s look at Tampa Bay next and their drafts. First, let’s look at how Tampa has drafted during the Don Sweeney tenure:
2015: No First Round Pick 2016: Brett Howden, 27th 2017: Cal Foote, 14th 2018: No First Round Pick 2019: Nolan Foote, 27th 2020: No First Round Pick
Howden, Foote and Foote. I’m not sure that Bruins fans would consider that a great outcome either, but again, Tampa is choosing at the back end of the draft, and they only have 219 games played from those players. But, Tampa does have two Stanley Cup championships in the last two seasons. It is also clear, the Cups have nothing to do with Tampa’s drafting during Sweeney’s tenure. Here’s why they have the Cups.
2014: Brayden Point, 79th Overall (3rd Round) 2013: Jonathan Drouin, 3rd Overall (Traded for Sergachev) 2012: Andrei Vasilevskiy, 19th Overall 2011: Nikita Kucherov, 58th Overall (2nd Round) 2010: Victor Hedman, 2nd Overall 2008: Steven Stamkos, 1st Overall
Let’s start with the obvious, Vasilevskiy was a great pick, no question. Arguably the best goaltender in the world right now and picked in the second half of the first round. Great job by Yzerman. So let’s look at the rest. I’ve already talked about how easy it is to get hits in the top 10 or the top 5, and Tampa shows that here with Stamkos, Hedman and Drouin/Sergachev. That leaves Point and Kucherov. Those picks turned out great for Tampa, no question there. But are they a sign that the team knows what they’re doing with those or there is a degree of luck involved? If we want to say “No, Yzerman is really good and knows what he’s doing, that’s why he made those picks!” then how would we also explain Dominik Masin, 35th overall in 2014, Jonathan MacLeod, 57th overall in 2014, Slater Koekkoek, 10th overall in 2012, Dylan Blujus, 40th overall in 2012, Brian Hart, 53rd overall in 2012. The point being that either we give the GM credit for the hits and blame for the misses, or we agree that anything in the bottom half of the first round or even from the second round on, is a high degree of luck. Tampa’s championship team was built from top 5 picks and a couple great hits later on.
Wrapping Up Sweeney’s Drafts
We peeled back a little further than the first round with a quick look at Tampa, so let’s see if Sweeney has had other hits after the first round:
2015: Brandon Carlo, 37th, Jeremy Lauzon, 52nd, Dan Vladar, 75th,
2016: Ryan Lindgren, 49th, Jack Studnicka, 53rd, Jeremy Swayman, 111th
No post-first round players after 2016 have appeared in the NHL but those six have appeared in 336, 90, 8, 130, 26, and 16 games respectively, for a total of 606 NHL games. I’m not going to go through all the teams to see how this compares, but it does show the Bruins have also had hits after the first round.
I’m open to tweaks and changes to the calculations and weighting, as I’m not certain that Jack Eichel’s games played have double the value of Connor McDavid’s, but I do think the Islanders deserve a lot of credit for getting a player like Beauvillier with the 28th pick. To summarize, this data puts the NHL drafts into context and shows how Sweeney’s counterparts have fared. No GM has consistent hits in the draft and every GM has some big misses. Hopefully this data gives Sweeney a little more credit than he gets from the Bruins fanbase.
Note: All statistics were compiled manually from sources including hockey-reference.com, nhl.com and Wikipedia.